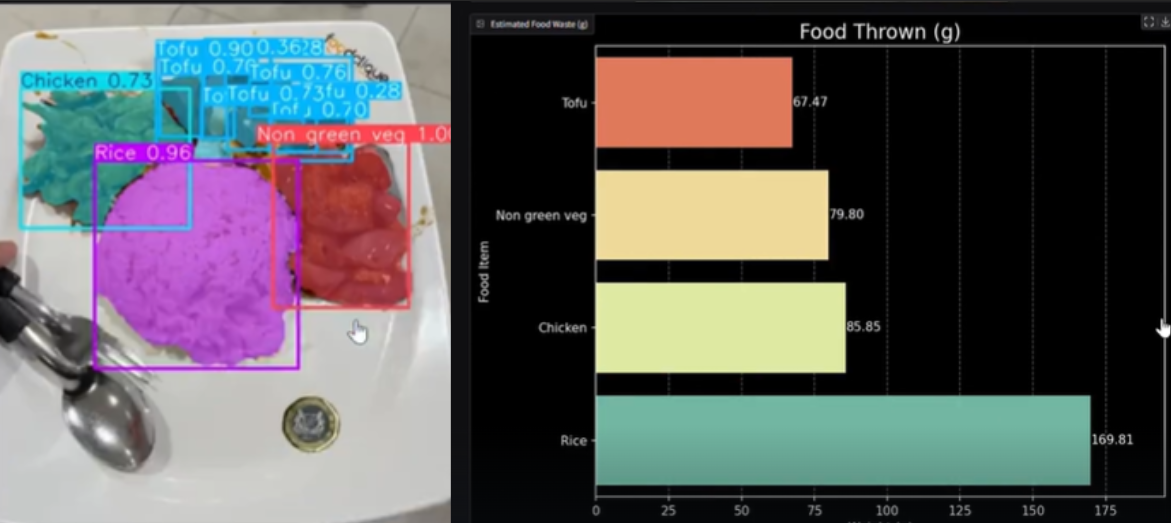
ClearPlate estimates how much food was wasted on a plate, and what kind of food it was, from a single photo. No scale, no labelling, no special hardware. You point a phone at a tray, the system segments the food, estimates the depth, infers the weight per food type, and logs it.
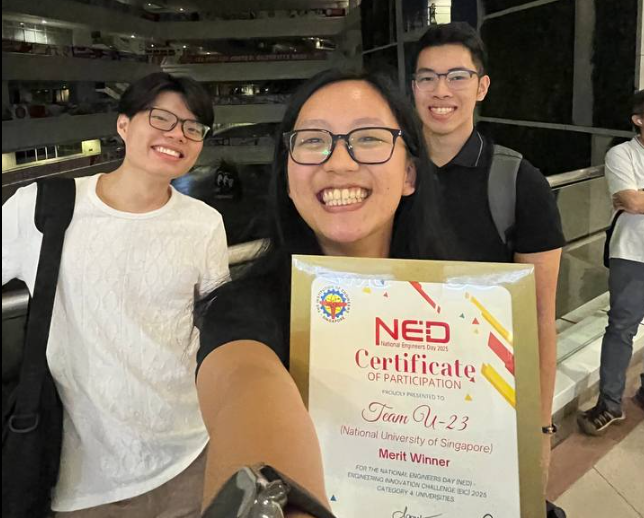
Built for the Engineering Innovation Challenge 2025, where it picked up a Merit award.
Why we built it
We were RC4 students at the time, and the dining hall was the obvious target. There’s a tray return point. There’s a queue. There’s a non-trivial amount of food being scraped into a bin every single meal, and the only existing data on it lives in someone’s vague intuition about “this menu was unpopular.”
Most existing food-waste tooling tracks waste at production or prep, before anyone has eaten anything. The bit nobody had a clean answer for was the post-consumption bin: what got served but didn’t get eaten. That’s the signal a dining hall actually wants, because that’s the one that tells you whether the menu landed.
A weighing scale at the tray return point gives you total weight. Useful, but uninformative. You don’t know if it was the rice, the vegetables, or the chicken curry. ClearPlate’s goal was to get to “people are wasting 30% of the rice and 5% of the chicken on Mondays” rather than just “people threw away 12kg of stuff today.”
How it works
Single image in, food-by-food waste estimate out. Four pieces:
- SAMv2 for segmentation. We bootstrap the food regions with minimal manual labelling, because every menu change means new food types and we wanted the labelling step to take minutes, not hours.
- YOLO11 detects the plate and a reference object in the frame (we use a coin) so we can scale pixel distances to real distances.
- XGBoost on hand-crafted features for monocular depth, which is what gives us a weight estimate. We tried full depth-estimation models early and the lift wasn’t worth the latency or the deployment headache.
- OpenCV + Gradio for the post-processing and the demo frontend.
The end-to-end loop, from “scan a few plates of a new menu” to “model is ready to estimate waste on that menu,” runs in under 30 minutes. That was the actual design constraint; if menu adaptation took a day, the dining hall would never use it.
What we cut
The temptation in a hackathon is to overbuild every layer. We didn’t. The classification model is intentionally simple, the depth model is XGBoost not a neural net, and the deployment is a single Docker container. None of those are the most accurate option on paper; all of them were the right call for a system that actually had to run on a dining-hall laptop with a webcam.
Demo
Deployment
Containerised with Docker. Runs on-prem or in the cloud. Has a basic API hook for integrating with existing POS or inventory systems, though we never deployed it that far in practice.
The Team
- Don Han – NUS Year 1 Business & Communications & New Media (DDP)
- Ng Jun Wei (me!) – NUS Year 3 Civil Engineering
- Ryan Tan – NUS Year 3 Business & Business Analytics (DDP)
- Teo Jia Xin – NUS Year 3 Environmental Engineering & Economics (DDP)
Thanks to our mentor Dr Jovan Tan for the guidance, and to the RC4 staff and students who let us collect data off their dinner plates.